1. 安装echarts图表
npm i echarts
2. 雷达图组件
<template>
<!--  雷达图-->
<!--  图表必须要给宽高-->
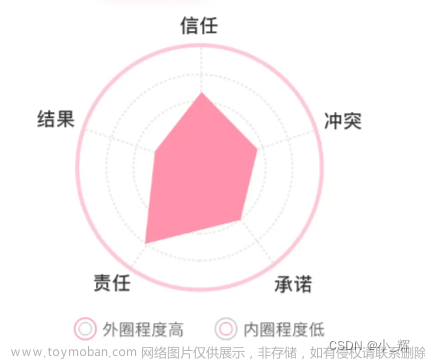
  <div ref="myDiv" class="radar-echart"></div>
</template>
<script>
// 完整加载
// var echarts = require('echarts')
// 按需加载 因为体积过大,这里只需要雷达图
var echarts = require('echarts/lib/echarts') // 引入主模块
require('echarts/lib/chart/radar')// 引入雷达图
// 引入提示框和标题组件
require('echarts/lib/component/tooltip')
require('echarts/lib/component/title')

export default {
  created() {
    // 实例创建完毕 但是页面没有渲染完毕
  },
  // 页面渲染完毕事件
  mounted() {
    const myChart = echarts.init(this.$refs.myDiv) // 得到图标的实例
    myChart.setOption({
      title: {
        text: '基础雷达图'
      },
      tooltip: {},
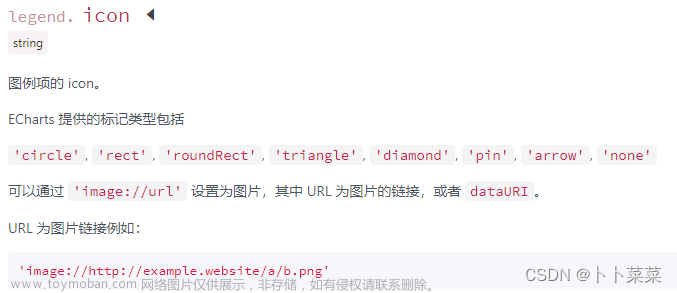
      legend: {
        data: ['预算分配(Allocated Budget)', '实际开销(Actual Spending)']
      },
      radar: {
        // shape: 'circle',
        name: {
          textStyle: {
            color: '#fff',
            backgroundColor: '#999',
            borderRadius: 3,
            padding: [3, 5]
          }
        },
        // 每个区域的最高值
        indicator: [
          { name: '工作效率', max: 100 },
          { name: '考勤', max: 100 },
          { name: '积极性', max: 100 },
          { name: '帮助同事', max: 100 },
          { name: '自主学习', max: 100 },
          { name: '正确率', max: 100 }
        ]
      },
      series: [{
        name: '预算 vs 开销(Budget vs spending)',
        type: 'radar',
        // areaStyle: {normal: {}},
        data: [
          {
            value: [10, 1, 100, 5, 100, 0],
            name: '张三'
          },
          {
            value: [50, 50, 50, 50, 50, 10],
            name: '李四'
          }
        ]
      }]
    })
  }
}
</script>
<style scoped>
.radar-echart{
  width: 600px;
  height: 400px;
}
</style>
文章来源地址https://www.toymoban.com/news/detail-861046.html
文章来源:https://www.toymoban.com/news/detail-861046.html
到了这里,关于雷达图插件(百度的)echarts的文章就介绍完了。如果您还想了解更多内容,请在右上角搜索TOY模板网以前的文章或继续浏览下面的相关文章,希望大家以后多多支持TOY模板网!

